Section 5 – Appendices
Appendix B – Beer Color
Ah, the many wonderful colors of beer! The pale straw of Belgian-style wit, the rich gold of Pilsener, the burnished copper hue of London ale, the rich mahogany of brown ale, the ruby-black highlights of porter, and the predawn darkness of stout—the very sight of these colors whets our imagination for the characteristic flavors of the styles. Beer color comes from the malts used—different types of malt have different characteristic colors, and these colors are expressed in the wort that is made from them. Malt extracts are just concentrated worts, and the color of the extract will depend on the malts that were mashed to make it. In addition, there are other factors in the brewing process that can also influence the color, such as caramelization during the boil.
When beers are judged in a competition, beer color is often the first check a judge makes as he determines how well a beer has been brewed to style. About an inch of beer will be poured into one of the clear plastic judging cups, the beer will be swirled to dispel any bubbles on the sides, and the beer will be held up to the light to gauge the color versus a color guide. Dark beers are often examined with a flashlight held behind to determine the clarity and its effect on the color. We can reasonably predict the final color of our beer by calculating the color contribution of each malt, malt extract, and adjunct that we use in our recipe. All malts are analyzed for color during production, and in the case of specialty malts, are produced to a specific color range. We can use the color ratings provided by the manufacturers to determine whether our recipe will meet the range for the intended style. Typical color ratings for several malts, malt extracts, and adjuncts are given in Tables 32 and 33.
The Basis of Color Rating
Historically, the color of beer and brewing malts has been rated as degrees Lovibond (°L). This system was created in 1883 by J.W. Lovibond and consisted of glass slides of various shades that could be combined to produce a range of colors. A standard sample of beer or wort would be compared to combinations of these slides to determine the rating. Malt color is determined by conducting a Congress mash (a standardized method) of the malt and measuring the wort color. This system was later modified to the Series 52 Lovibond scale, which consisted of individual slides or solutions for specific Lovibond ratings, but the system still suffered from inconsistency due to fading, mislabeling, and human error.
In 1950 the American Society of Brewing Chemists (ASBC) adopted the utilization of optical spectrophotometers to measure the absorptance of a specific wavelength of light (430 nanometers) through a standard-sized sample. A darker wort/beer absorbs more light and yields a higher measurement. This method allowed for consistent measurement of samples, and the Standard Reference Method (°SRM) for determining color was born. The SRM method was originally set up to approximate the Series 52 Lovibond scale, and the two scales can be considered to be nearly identical for most of their range. However, the resolution of a spectrophotometer diminishes greatly as the worts darken and very little light can penetrate the sample to reach the detector. To accommodate dark worts, the sample is diluted, and the measurement is scaled to assign an undiluted value. Unfortunately, dilutions have been shown to be nonlinear for beers made from highly colored malts.
When provided with consistent, precise references, the human eye can distinguish very narrow differences in color, because it can see a variety of wavelengths of visible light as opposed to the information conveyed by a single wavelength. There is less variation in a single wavelength measurement, but there is also a corresponding loss in range. For this reason, the Series 52 Lovibond scale is still in use today, in the form of precision visual comparators, and is most often used to determine the rating of dark/roasted malts. The use of the comparator is most prevalent in the malting industry, and thus the color of malts is discussed as °L, while beer color is discussed as °SRM, though the basis (absorptance at 430 nm) is the same.
Prior to 1990, the European Brewing Congress (EBC) used a different wavelength for measuring absorptance, and conversion between the two methods was an approximation. Today, the EBC scale uses the same wavelength for measurement but uses a smaller sample glass. The °EBC rating for a malt or beer is not equivalent to the °L rating. If you are converting from EBC units, it is probably a good idea to check with the manufacturer to see which EBC method/wavelength it is using. Some malt manufacturers have reportedly not upgraded to the new standard. The current EBC scale for rating beer color is about twice the °SRM rating. The actual conversion factor between the two methods is 1.97, but to argue whether an Irish stout with an EBC rating of 90 is 45 or 45.6 °SRM is pointless.
Color swatches to illustrate seven levels of beer color are shown on the inside of the front cover. These color swatches for °SRM colors are taken from Promash Brewing Software, version 1.8, and are representative of beer that has been poured to a depth of about 1½ inches in a typical 6-ounce clear plastic judging cup, swirled to de-gas, and held up to good lighting against a white background.
The main constituents of color in malts are the melanoidins produced by Maillard or browning reactions. Browning reactions between sugars and amino acids occur whenever food is heated—think toast. Different heating methods with different sugars and amino acids will produce different colors—from amber, to red, to brown, to black. Thus, the wide spectrum of beer color is due to the variety of germination and kilning procedures used in the production of malts. The final color of a beer can be estimated from a recipe by adding up the melanoidin contributions in the form of malt color units (MCU). An MCU is like an alpha acid unit (AAU) for hop bitterness (IBU) calculations. The color rating of the malt (°L) is multiplied by the weight (pounds) used in the recipe, just like the weight of a hop addition is multiplied by its alpha acid rating. To estimate the °SRM color of a beer, the MCUs are divided by the recipe volume and multiplied by a constant that is like the percent utilization in the IBU calculation. For light-colored beers (yellow/gold/light amber) the relationship between °SRM and MCU is approximately 1 to 1.
As a brief example, if 8 pounds of two-row lager malt (2 °L) and 2 pounds of Vienna malt (4 °L) are used for a 5-gallon batch, the estimated color would be (8 x 2 + 2 x 4) / 5 = 4.8, or about 5 °SRM. Unfortunately, this simple model does not work when the MCUs exceed 15. (See Figure 167.) Linear models have been proposed by Mosher and Daniels, but data for the full spectrum of beer color may be better fit by an exponential curve, such as the one described by Morey’s equation. See Figure 166. Proposed Models for Beer Color as a Function of MCU °SRM = MCU (traditional) °SRM = 0.3 x MCU + 4.7 Mosher °SRM = 0.2 x MCU + 8.4 Daniels °SRM = 1.49 x MCU^0.69 Morey The fault of the linear models proposed by Mosher and Daniels is that there is a lower limit for beer color at 4.7 and 8.4 °SRM, respectively. Obviously, there are beer styles such as Belgian-style wit, Pilsener, and American light lager that are lighter than these limits. An exponential equation fits the data better, because the function is nearly equal to MCU at low MCU values, but as the MCUs go to higher values (corresponding to brown ales, porters, and stout), the actual color diverges from the MCU = °SRM line and increases at a lower rate, as depicted by the linear models of Mosher and Daniels. A beer with an MCU of 200 compared to one with a rating of 100 is still just “very dark,” instead of twice as dark, as the °SRM = MCU model would have you believe. Even expert beer judges cannot discern a difference between color values greater than 40 °SRM. Another aspect of beer color that needs to be mentioned is “hue.” Different beers with the same °SRM rating can actually be different hues, because the measurement is based on the absorptance of a single wavelength of (blue-violet) light. And actually, it isn’t the absorptance of the light that’s measured, but how much of the light that gets through the sample to the detector. The human eye sees all the visible wavelengths and will perceive other colors transmitted/reflected from the sample that the spectrophotometer detector will not. This drawback in the current ASBC method was noted in a recent brewing study at the University of California at Davis. In the study, four beers—two lagers, a pale ale, and a stout—were diluted to the same rating (3.5 to 3.6 °SRM). A group of 31 people were presented with 10 pairings of these diluted beers and asked to determine if they were the same or were different. The results clearly showed that the panelists could correctly determine a difference in color between different beers, except in the case of the two lagers, which were perceived as being the same. The original color of the undiluted all-malt lager was 8 °SRM, and the undiluted color of the other lager, containing cereal adjuncts, was 4 °SRM. The pale ale was 25 °SRM. There was virtually no difference (less than 1 °) between the ASBC method and a Series 52 Lovibond Comparator (Tintometer Ltd., Salisbury, U.K.) in the undiluted color results for each of the three paler beers. The stout was the exception, with the comparator measuring 115 °L and the spectrophotometer measuring 86 °SRM. This difference illustrates the drawback mentioned earlier of the ASBC method for determining the color of very dark malts and beers.
Other Color Factors
The color of the malts is not the only factor that determines a beer’s final color. Other variables, such as boil time, heating method, hopping rate, yeast flocculation, clarity, age/oxidation, etc., will affect the absorptance of light and the perceived color. Long boil times over high heat will promote the Maillard reactions of sugars and proteins that darken the wort. The oxidation of polyphenols (tannins) from grain husks or hop cones also contributes to wort darkening. Wort that has been oversparged or heavily hopped (like that for an India pale ale) will have a greater propensity for darkening as it ages. Wort will also lighten during the boil and subsequently during chilling, as proteins combine with polyphenols to form the hot and cold break. Other color-carrying compounds will settle out during fermentation, as the yeast flocculates. And of course, the overall clarity of a beer will affect the degree to which light is absorbed and its perceived color—cloudy beers appear darker and will measure darker if the beer is not clarified by centrifuge or filtering.
These other factors that affect beer color are diverse and significant enough that the actual color could be plus or minus 20% of the calculated value. That being the case, a simplified exponential equation of °SRM = 1.5 x MCU^0.7 is just as valid as the derived values of Morey’s equation. My purpose in stating this isn’t to propose a new model, but instead to point out the inherent limits of any model for beer color. None of the three models is necessarily any more correct than another, although Morey’s may be more forgiving for very light beer styles. Hopefully this caveat will prevent the more technical readers of this appendix from trying to calculate color to the fourth decimal place.
These other factors that affect beer color are diverse and significant enough that the actual color could be plus or minus 20% of the calculated value. That being the case, a simplified exponential equation of °SRM = 1.5 x MCU^0.7 is just as valid as the derived values of Morey’s equation. My purpose in stating this isn’t to propose a new model, but instead to point out the inherent limits of any model for beer color. None of the three models is necessarily any more correct than another, although Morey’s may be more forgiving for very light beer styles. Hopefully this caveat will prevent the more technical readers of this appendix from trying to calculate color to the fourth decimal place.
Estimating Beer Color
To plan the color of your recipe, calculate the MCU values for each of your malts and grains, and then apply the result to one of the color models. To do this, multiply the malt’s Lovibond rating by the number of pounds that you are going to use, and divide by the recipe volume. See above for the color model equations. Let’s look at some examples.
BJCP Style Guidelines for California Common Beer OG = 1.044-1.055 FG = 1.011-1.014 IBU = 35-45 Color = 8-14 °SRM
BJCP Style Guidelines for California Common Beer OG = 1.044-1.055 FG = 1.011-1.014 IBU = 35-45 Color = 8-14 °SRM
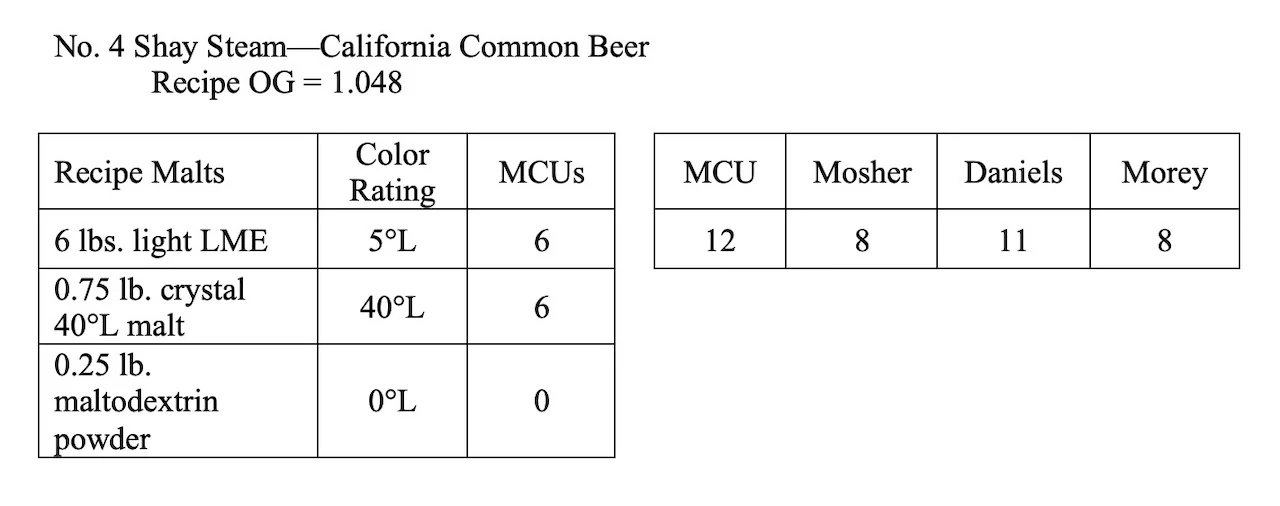
Comment: In this example, the recipe malts yield an °SRM color rating within the BJCP guidelines for all three color models. The brewer can be confident that the entry would not be marked down for color.
BJCP Style Guidelines for Brown Porter OG = 1.040-1.050 FG = 1.008-1.014 IBU = 20-30 Color = 20-35 °SRM
BJCP Style Guidelines for Robust Porter OG = 1.050-1.065 FG = 1.012-1.016 IBU = 25-45 Color = 30+ °SRM
BJCP Style Guidelines for Brown Porter OG = 1.040-1.050 FG = 1.008-1.014 IBU = 20-30 Color = 20-35 °SRM
BJCP Style Guidelines for Robust Porter OG = 1.050-1.065 FG = 1.012-1.016 IBU = 25-45 Color = 30+ °SRM
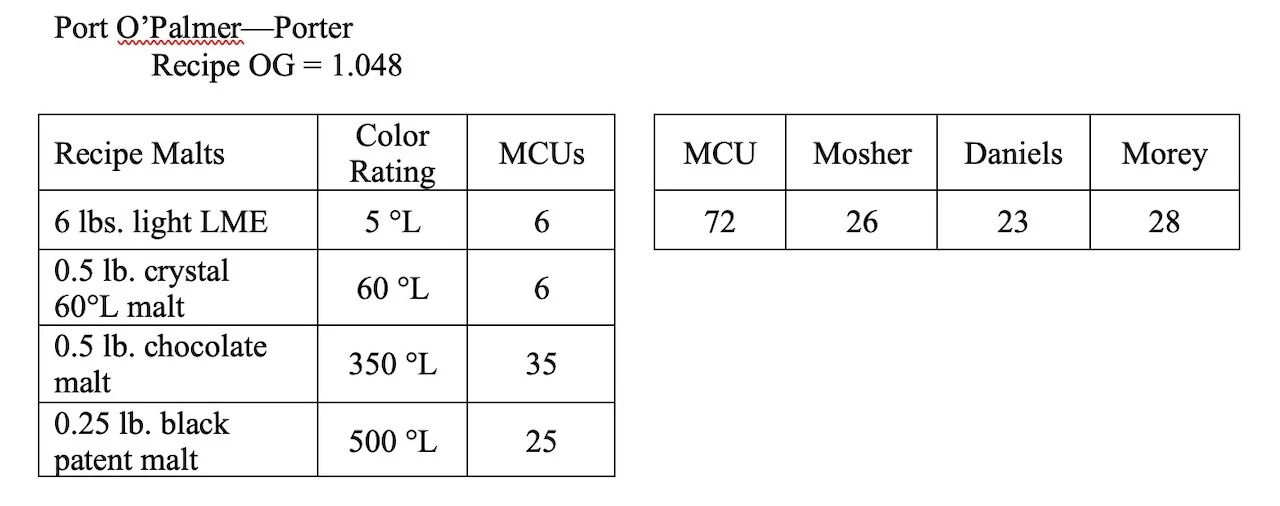
Comment: In this example, the recipe malts yield an °SRM color rating and an OG within the BJCP guidelines for Brown Porter, although the use of black patent malt adds some roast character that is more appropriate to the Robust Porter category. In this case, the brewer can use color modeling to adjust the recipe to firmly place it in the Robust Porter category, if he or she wishes. Both the OG and the color would need to be increased by a few points. There are lots of options to do this; here are three:
1. Add 1.5 pounds of dark DME. This will add about 12 points to both the OG and the MCU total, giving color estimates of 30, 25, and 32, respectively. The drawback to this approach is that the OG has increased significantly to 1.060 without changing the color very much.
2. Increase the half-pound of chocolate malt to 1 pound. This will change the MCU total to 107, without changing the OG much, giving estimates of 37, 30, and 37, respectively. Still need to increase the gravity, though. . . .
3. Increase the light LME from 6 to 7 pounds, and increase the chocolate malt to 1 pound. The MCU total only changes by 1 point from the previous option, keeping the total color almost exactly the same. However, the extra pound of extract increases the OG to 1.055, which is respectable for a Robust Porter.
Summary
Hopefully this appendix has given you a good understanding of how beer color is measured and how it can be estimated to help your brewing. It is also important to remember that final beer color is driven by many factors from all parts of the brewing process, and that these are not factored into the color models. You will need to examine your equipment, your processes, and your beers to determine which model works best for you, just as in the case of hops and IBU calculations. These tools are not the end, they are the means to an end, and the proof is in the beer. Good Brewing.
Author’s Note: This work was originally published as a feature article in Brew Your Own, Volume 9, No. 3, 2003.
Table 32 - Specified Colors for Malt Extracts
* Information taken from the manufacturers’ websites ** Converted from EBC

Table 33 – Some Typical Color Ratings of Common Malts and Adjuncts
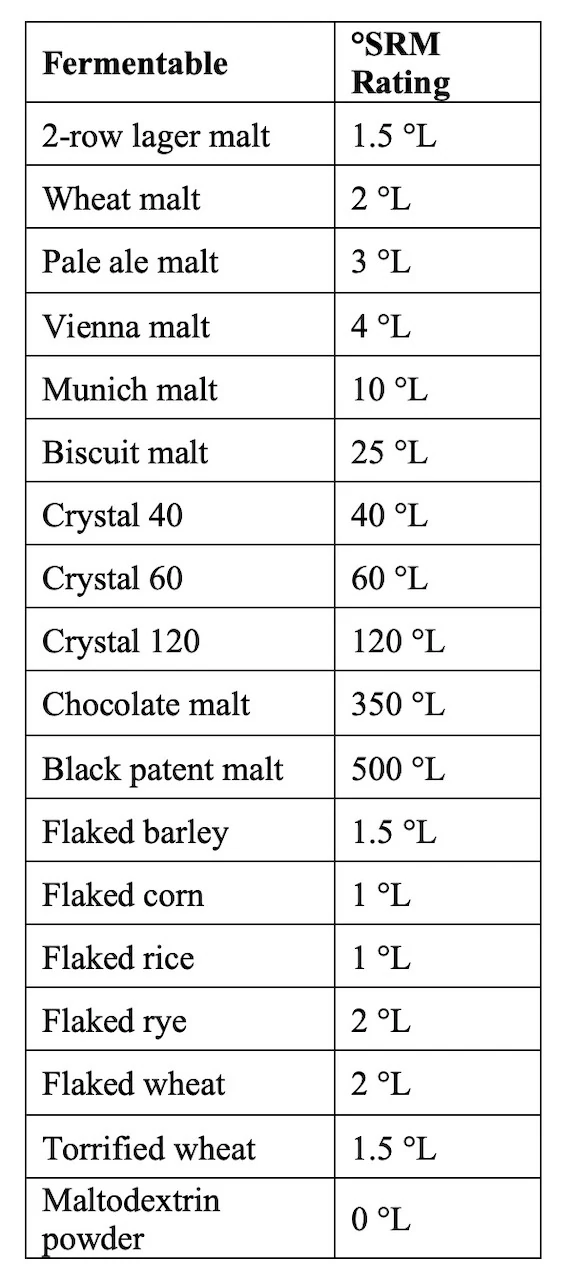
Figure 89 – Joe Brewer stirs in the malt extract and the boil is off and running. Brewing proceeds exactly as described in Chapter 7.
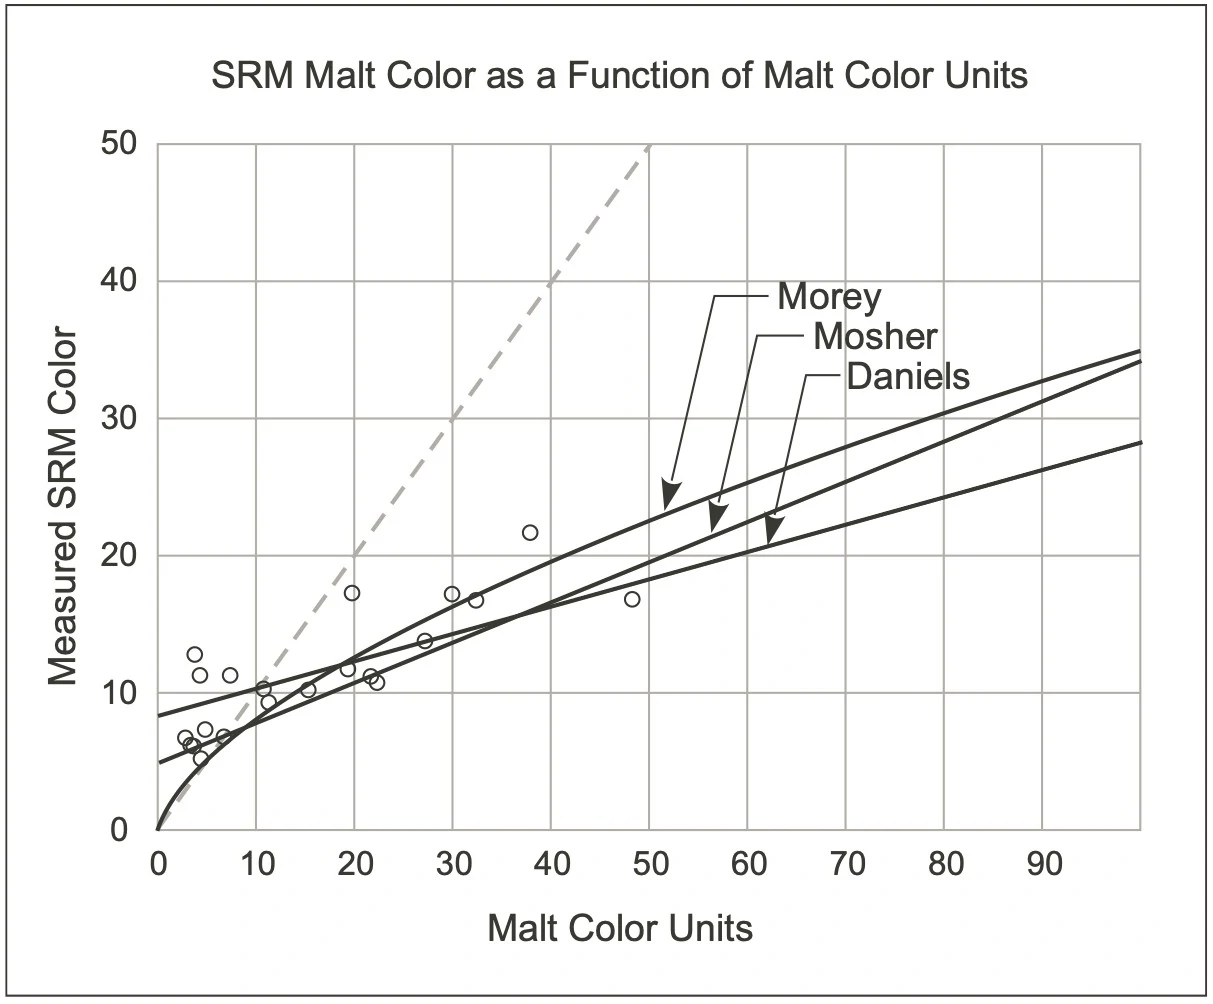
Figure 167: A comparison of four models for final beer color. The orange line is a reference for the case if °SRM = MCU. The green line is Mosher, the blue is Daniels, and the red is Morey. Analysis of commercial as well as homebrewed beer has shown that the measured color tapers off, even as the malt color contributions increase dramatically. (The data shown here is from the article “Beer Color Demystified—Part III: Controlling and Predicting Beer Color,” by Ray Daniels, Brewing Techniques, Vol. 3, No. 6, 1995.)
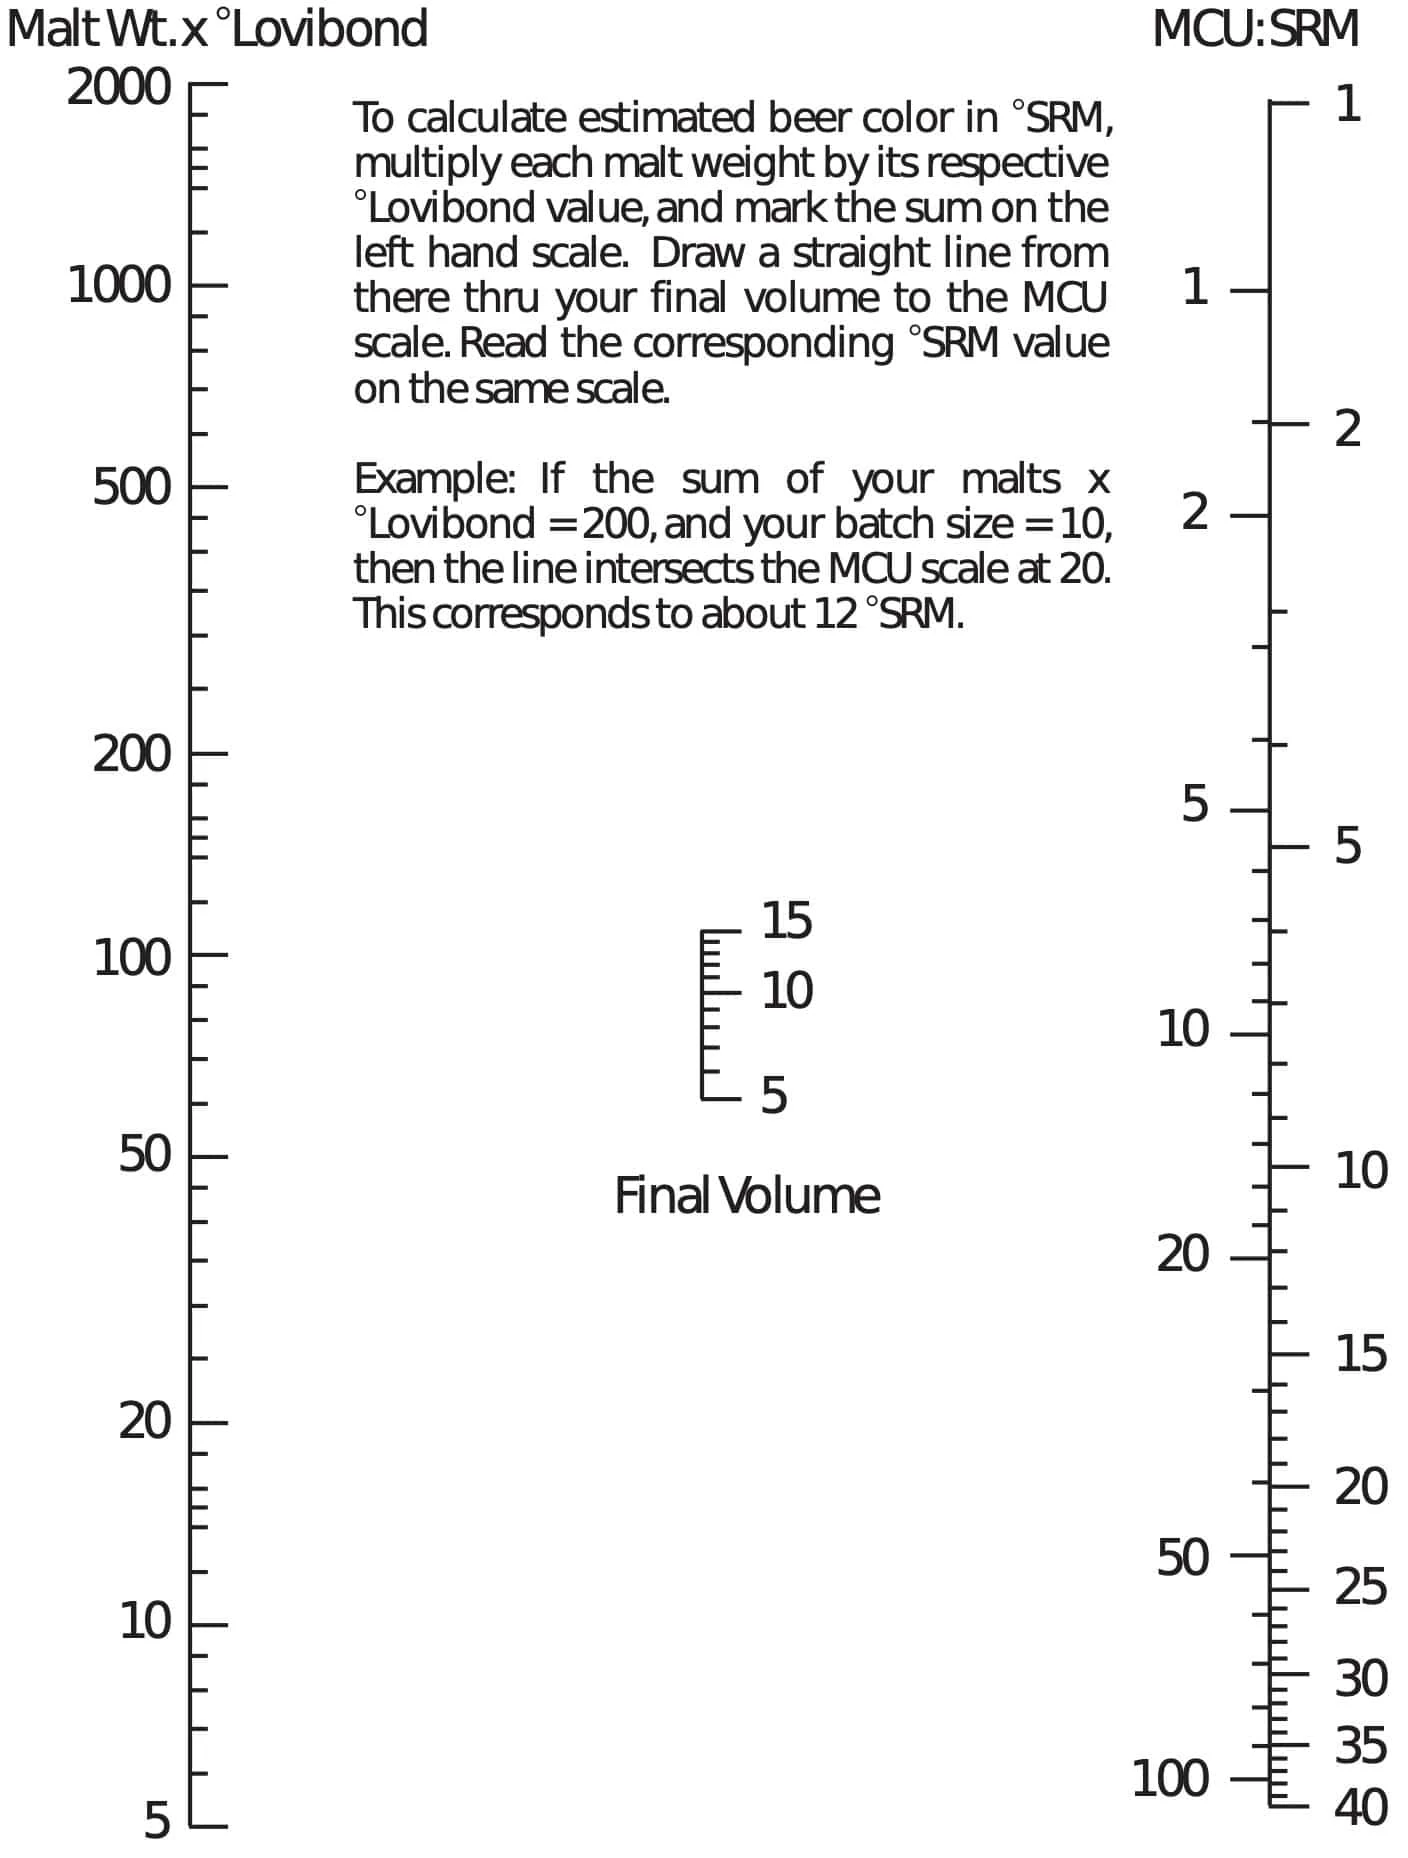
Figure 168—Nomograph for calculating °SRM from malt color units (MCUs). To use, multiply weight of the grain (pounds) by its color rating in °Lovibond, and mark the number on the L*lbs. scale. Draw a line from there through the batch size number (e.g., 5 gallons) to the MCU scale. This is the MCU contribution for that particular grain. You will need to add up the MCUs for all the malts in the grain bill and mark that total on the MCU scale to read off the calculated °SRM. This nomograph utilizes the Morey color model.